APPROBATO CONSULTING
Delivering insights and smarter decisions through Data Analysis.
Business Consulting focused in Intelligence.

Qlik Sense Course – Express
The course is under development but you can access the first module here!
Check out the videos below to learn about the basics of Qlik.
If you are interested in a Qlik Course to learn about Data Visualization and Data Manipulation (Script), fill this form to be notified when the content is ready! (hyperlink)
▷ Subscribe to my channel, where you will find much more Qlik content (beyond the basics).
Introduction
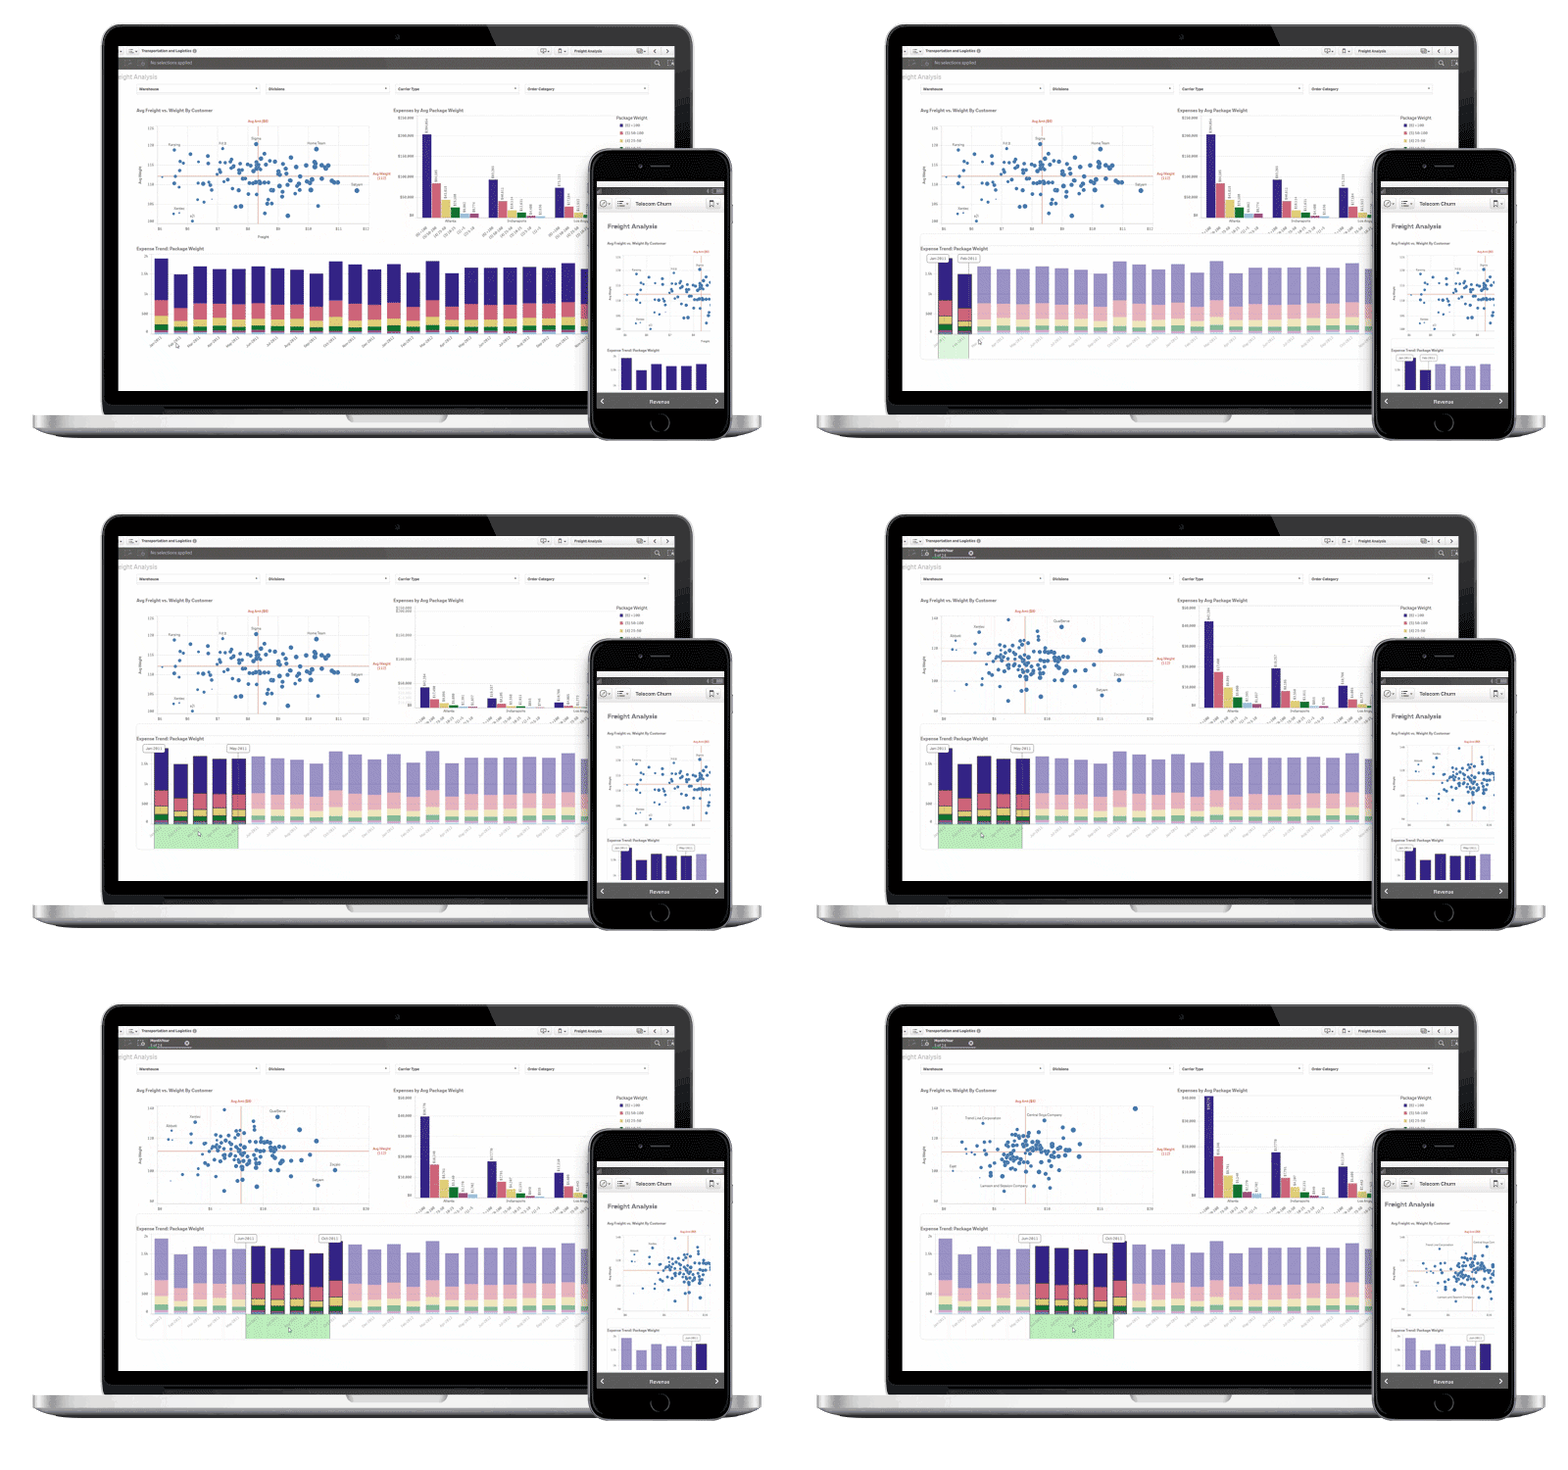
Explore some Demos in Qlik’s Website
Go to https://demos.qlik.com/qliksense and check out some dashboards made public.
Qlik Basics
Download and Unlock Qlik Sense Desktop
To download Qlik go to www.qlik.com/qliksensedesktopdownload
Qlik Garden webpage:
https://developer.qlik.com/garden
Qlik Basics
The hub and App Overview
Loading data and checking the main navigation of the App.
Find the xlsx table used in the video here in this link (hyperlink).
Qlik Basics
Properties of the Bar Chart
How to create and customize a bar chart
Qlik Basics
Properties of other Charts
How to create and customize a other charts
Qlik Basics
First App: Analyzing Data in Accidents database
Link to the original dataset used:
https://www.kaggle.com/datasets/sobhanmoosavi/us-accidents
Download the csv showed in the video clicking here (hyperlink).
Qlik Basics
The Stacked Bard Chart
and its properties.
Qlik Basics
Master Items
Instead of changing the same expression in multiple visuals, use Master Items to facilitate your work.
Qlik Basics
Maps and Layers
Types of Maps and how to use them.
Qlik Basics
Drill Down using Master Items
Dive in some dimension using the drill down.
Qlik Basics
GetSelectedCount() Expression
Using expressions to hide or display map layers.
Check out the documentation to learn about this and other expressions here.
Qlik Basics
Customize the App
Change the Thumbnail and give the app some other theme with different colors.